Master Your Weekend Metrics Audit with SchedulifyX Analytics

SchedulifyX Team · August 1, 2026

Discover how to leverage the SchedulifyX analytics dashboard for a comprehensive weekend metrics audit, optimizing your social media strategy for maximum ROI.

In the fast-paced world of digital marketing, the workweek is often consumed by content creation, client meetings, and putting out immediate fires. By the time Friday afternoon rolls around, diving deep into data often feels like an impossible task. However, the most successful social media managers know a secret: the weekend is the perfect time for a comprehensive social media metrics review. With the noise of the workweek behind you, a weekend metrics audit provides the clarity needed to make data-driven decisions that propel your brand forward.

Welcome to our deep dive into the latest Product Updates for the SchedulifyX analytics suite. In this comprehensive guide, we will explore how to utilize the powerful features of our enhanced social media analytics dashboard. We will walk you through a detailed weekend routine that covers engagement rates, follower growth trends, content performance, optimal posting times, and the ultimate goal: ROI tracking. Grab your weekend coffee, open your SchedulifyX dashboard, and let us transform your raw data into actionable strategies.

The Power of the Weekend Metrics Audit

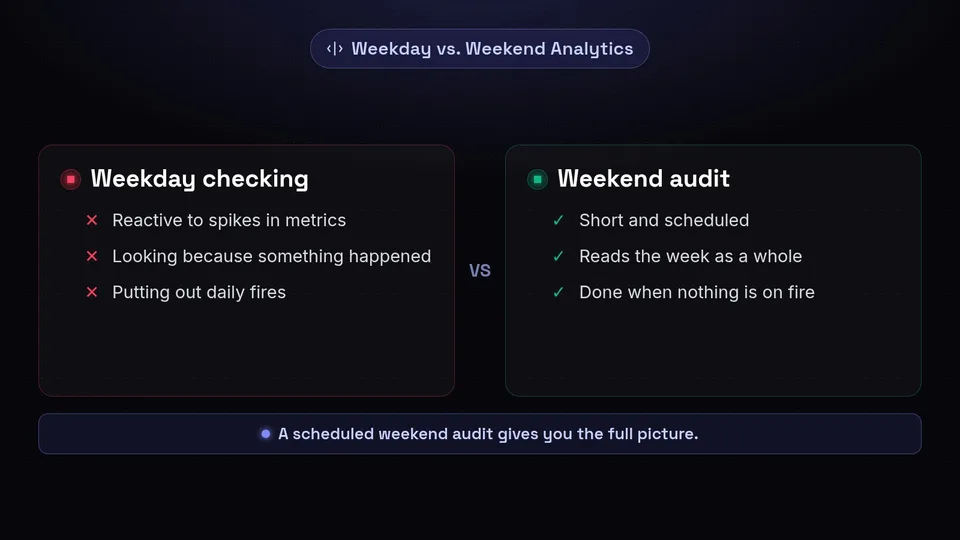
Why wait for the weekend to look at your data? During Monday through Friday, marketers are often in reactive mode. You are responding to comments, adjusting copy on the fly, and managing stakeholder expectations. A weekend metrics audit shifts you from a reactive state to a proactive, strategic mindset.

Conducting your social media metrics review on a Saturday morning or a quiet Sunday afternoon allows you to look at a complete, closed dataset for the previous week (Monday to Sunday). It eliminates the mid-week anomalies and gives you a holistic view of your performance. Furthermore, the psychological benefit of reviewing data without the constant ping of Slack messages or incoming emails cannot be overstated. You have the mental bandwidth to ask "why" rather than just "what."

"Data without context is just noise. The weekend provides the quiet necessary to find the context, allowing marketers to turn numbers into compelling narratives and actionable strategies."

By utilizing the SchedulifyX analytics platform during this downtime, you can set your intentions and schedule your optimized content for the upcoming week before Monday morning even begins. This proactive approach is what separates average social media managers from industry leaders.

Before we dive into the specific metrics, it is crucial to familiarize yourself with the newly updated social media analytics dashboard within SchedulifyX. We have designed this interface to be both incredibly powerful for data scientists and intuitively accessible for creative marketers.

The Overview Hub

When you log into SchedulifyX and click on the 'Analytics' tab, you are greeted by the Overview Hub. This is your command center. It provides a macro-level view of your cross-platform performance. You will see aggregated data for total impressions, total engagements, and overall audience growth across Instagram, LinkedIn, X (formerly Twitter), Facebook, and TikTok.

Customizable Widgets

One of the standout features of the SchedulifyX dashboard is the ability to customize your view using drag-and-drop widgets. If social media KPI tracking for your specific campaign relies heavily on video views rather than link clicks, you can pin the Video Performance widget to the top of your dashboard. This customization ensures that during your weekend metrics audit, you are not wasting time hunting for the data that matters most to your unique goals.

Cross-Platform Filtering

SchedulifyX allows you to isolate data by platform, by specific campaign tags, or by date range. The intuitive date picker lets you easily select "Last Week" (Mon-Sun) with a single click, instantly populating the dashboard with the exact dataset you need for your weekend review.

Social Media KPI Tracking: Fundamentals and Frameworks

Effective social media KPI tracking is the foundation of any successful marketing strategy. However, not all metrics are created equal. During your weekend audit, it is vital to distinguish between vanity metrics and actionable metrics.

Vanity Metrics vs. Actionable Metrics

Vanity metrics—like raw follower counts or total impressions—might look great in a presentation, but they rarely tell you how to improve your business. Actionable metrics, on the other hand, tie directly to your business objectives. These include conversion rates, click-through rates (CTR), and engagement rates per impression.

With SchedulifyX analytics, we encourage users to align their KPI tracking with the standard marketing funnel:

  • Awareness: Reach, Impressions, Share of Voice.
  • Consideration: Engagement Rate, Click-Through Rate, Video Completion Rate.
  • Conversion: Cost Per Click (CPC), Lead Generation, Sales ROI.
  • Loyalty: Customer Retention, Brand Mentions, User-Generated Content (UGC) rates.

By categorizing your KPIs within the SchedulifyX dashboard, your weekend metrics audit becomes a structured evaluation of your entire marketing funnel, rather than a random assortment of disconnected numbers.

Deep Dive: Analyzing Engagement Rates

Engagement is the currency of the social media realm. It tells you whether your audience actually cares about what you are saying. However, calculating and interpreting engagement can be complex. The social media analytics dashboard in SchedulifyX simplifies this by breaking down engagement into granular, easy-to-understand metrics.

Understanding the Engagement Formula

SchedulifyX calculates your True Engagement Rate by taking the total number of engagements (likes, comments, shares, saves, clicks) and dividing it by your total Reach (not just followers), then multiplying by 100. This provides a much more accurate picture of how compelling your content is to the people who actually saw it.

The Hierarchy of Engagement

During your weekend audit, do not just look at the total engagement number. Dive into the types of engagement. SchedulifyX categorizes these to help you understand user intent:

  • Passive Engagement (Likes): Indicates basic approval but low investment.
  • Active Engagement (Comments): Shows a willingness to converse and signals community building.
  • Advocacy (Shares/Retweets): The highest form of endorsement. Users are willing to attach your brand to their personal identity.
  • Intent (Saves/Bookmarks): Indicates high-value content that the user wants to reference later, highly correlated with educational or product-focused posts.

If your weekend social media metrics review reveals high likes but low saves and shares, your content might be visually appealing but lacking in deep, actionable value. Use this insight to pivot your strategy for the upcoming week, perhaps by introducing more carousel tutorials or industry infographics.

While we cautioned against viewing raw follower count as the ultimate KPI, tracking the trend of your follower growth is essential for understanding your brand's momentum and audience health.

Net vs. Gross Follower Growth

The SchedulifyX Audience Health tab provides a clear visualization of both your gained followers and lost followers (unfollows) over time. This net growth metric is crucial. If you run a viral campaign that gains you 5,000 followers, but you simultaneously lose 4,000 long-term followers because the campaign alienated your core demographic, your gross growth looks amazing, but your net growth and audience health are suffering.

Correlating Growth with Content

One of the most powerful features to utilize during your weekend metrics audit is the SchedulifyX Growth Overlay. This tool overlays your follower growth chart with your publishing timeline. You can visually pinpoint exactly which posts, campaigns, or days correlated with a spike in followers or a sudden drop-off.

Pro Tip for your weekend review: Look for the "quiet churn." If you notice a steady, slow decline in followers on days you do not post, it may indicate that your brand is losing top-of-mind awareness. Conversely, if you lose followers every time you post a specific type of promotional content, it is a clear signal from your audience to adjust your tone or frequency.

Identifying Best-Performing Content Types

Not all content formats resonate equally. A text-heavy LinkedIn post might generate massive leads, while a similar concept on Instagram Reels drives pure brand awareness. Your weekend social media metrics review must include a rigorous analysis of content formats.

The Content Matrix in SchedulifyX

Within the SchedulifyX analytics suite, navigate to the Content Performance tab. Here, you will find the Content Matrix, which automatically categorizes your published posts by format (Single Image, Carousel, Short-form Video, Long-form Video, Text-only, Link previews) and plots them against your chosen KPIs.

Analyzing by Objective

During your audit, ask yourself what the objective of the week was. If the goal was engagement, filter the Content Matrix by Engagement Rate. You might discover that while your highly produced videos got the most views, your simple, text-based graphic carousels generated 300% more comments and saves.

This data is invaluable for resource allocation. If you are spending 20 hours a week editing videos that yield low engagement, and only 2 hours creating graphics that drive high conversions, your weekend audit has just given you the data needed to restructure your entire workflow for the following week.

Tagging and Thematic Analysis

SchedulifyX allows you to apply custom tags to your posts (e.g., #ProductLaunch, #BehindTheScenes, #UserGenerated). During your weekend audit, you can filter your analytics by these tags. This reveals not just which formats work, but which topics and themes your audience truly cares about.

Optimal Posting Time Analysis: The SchedulifyX Heatmap

One of the most common questions in social media marketing is, "When is the best time to post?" The truth is, there is no universal answer. The best time to post is when your specific audience is online and ready to engage. Finding this exact window is a core component of a thorough weekend metrics audit.

Moving Beyond Averages

Many basic analytics tools will tell you that "Thursdays at 2 PM" is your best time. But averages lie. A viral post on a random Tuesday night can skew your entire monthly average. SchedulifyX takes a more sophisticated approach.

The Engagement Heatmap

The SchedulifyX Engagement Heatmap analyzes the historical performance of your content and the active hours of your unique follower base. It visualizes this data in a color-coded weekly grid. Darker spots indicate high probability windows for maximum reach and engagement, while lighter spots show when your audience is dormant.

During your weekend social media metrics review, compare your actual posting schedule from the past week against the Heatmap. Did you publish your most important campaign announcement during a "light" window? If so, you left engagement on the table.

Predictive Scheduling

The true power of SchedulifyX analytics lies in its integration with our publishing tools. Once you have identified your optimal times during your weekend audit, you can use the SchedulifyX Auto-Queue feature. Simply drop your content for the upcoming week into the queue, and the platform will automatically deploy it during the dark spots on your unique Heatmap, ensuring maximum visibility without you having to manually calculate time zones or set individual timers.

ROI Tracking and Conversion Metrics

At the end of the day, social media must contribute to the bottom line. Whether you are driving e-commerce sales, B2B lead generation, or newsletter signups, proving Return on Investment (ROI) is the ultimate goal of social media KPI tracking.

Connecting Social to Sales

The SchedulifyX ROI Dashboard bridges the gap between social engagement and actual business results. By integrating with Google Analytics and major e-commerce platforms (like Shopify and WooCommerce), SchedulifyX allows you to track the complete customer journey from the first social media impression to the final checkout.

UTM Parameter Automation

To accurately track ROI, you must use UTM parameters on your links. SchedulifyX makes this effortless with our automated UTM builder. Every link you schedule through the platform is automatically tagged with the source, medium, and campaign name.

During your weekend audit, navigate to the Conversions tab. Here, you can see exactly how much revenue or how many leads were generated by specific social media posts. You can calculate your exact Cost Per Acquisition (CPA) if you are running boosted posts alongside organic content.

The ROI Calculation

Use your weekend downtime to run this vital calculation: Subtract your total investment in social media (including software costs, ad spend, and the hourly rate of content creation) from the total revenue generated by social media conversions. Divide that number by your total investment, and multiply by 100. This is your Social Media ROI percentage.

Having this concrete number ready by Monday morning empowers you to advocate for larger budgets, justify your strategy to stakeholders, and confidently scale the tactics that are actually driving revenue.

Step-by-Step Guide: Your Weekend Metrics Review Routine

Knowledge is only powerful when applied. To help you integrate SchedulifyX analytics into your workflow, we have developed the ultimate weekend metrics audit checklist. Dedicate 45 to 60 minutes this weekend to run through these steps.

Step 1: Set the Stage (5 Minutes)

  • Log into your SchedulifyX account.
  • Navigate to the Analytics Overview.
  • Set your date range to "Last Week" (Monday - Sunday).
  • Export last week's report if you maintain an external archive.

Step 2: The Macro Review (10 Minutes)

  • Check your top-level KPIs: Total Reach, Total Engagement, and Net Follower Growth.
  • Did you hit your weekly targets? Note any major positive or negative deviations from the previous week.
  • Look at the Growth Overlay chart to identify any major spikes in followers or unfollows.

Step 3: Content Deep Dive (15 Minutes)

  • Open the Content Performance tab.
  • Sort your posts from the past week by Engagement Rate (not just total likes).
  • Identify your top 3 performing posts. Ask yourself: What format were they? What was the hook? What time were they posted?
  • Identify your bottom 3 performing posts. Be honest about why they failed. Was the copy too promotional? Was the visual unappealing?

Step 4: Audience and Timing Optimization (10 Minutes)

  • Review the SchedulifyX Engagement Heatmap.
  • Has your audience's behavior shifted? (e.g., Are they suddenly more active on Sunday evenings?)
  • Adjust your SchedulifyX Auto-Queue time slots for the upcoming week based on any new heatmap data.

Step 5: ROI and Conversion Check (10 Minutes)

  • Navigate to the ROI Dashboard.
  • Review the traffic and conversions driven by your automated UTM links.
  • Identify which specific platform or content theme drove the highest quality traffic (lowest bounce rate, highest conversion rate).

Step 6: Actionable Strategy Formulation (10 Minutes)

  • Based on your findings, write down 3 specific actions for the upcoming week.
  • Example Action 1: "Double down on carousel posts, as they drove 40% more saves this week."
  • Example Action 2: "Shift afternoon posting times from 2 PM to 4 PM based on the new Heatmap data."
  • Example Action 3: "Pause promotional video content on LinkedIn, as it yielded a 0% conversion rate and high unfollows."

Conclusion: Elevate Your Strategy with SchedulifyX

A thorough social media metrics review is not just about looking at numbers; it is about uncovering the story behind those numbers. By utilizing the quiet hours of the weekend to conduct a deep-dive audit, you position yourself ahead of the curve. You transition from guessing what might work to knowing exactly what does.

The SchedulifyX analytics dashboard is built specifically to facilitate this level of deep, actionable insight. From granular social media KPI tracking to intelligent posting heatmaps and comprehensive ROI attribution, SchedulifyX provides all the tools you need to turn raw data into your most powerful marketing asset.

Do not let another week go by flying blind. Commit to the weekend metrics audit. Log into your SchedulifyX account this Saturday, follow our step-by-step routine, and watch as your engagement, growth, and ROI soar to new heights. If you are not yet a user, start your free trial today and experience the future of social media analytics dashboards.

SchedulifyX