Create Professional Social Media Reports in 10 Minutes
SchedulifyX Team · August 4, 2026
Learn how to craft client‑ready social media reports in under 10 minutes with SchedulifyX: metric selection, visualizations, summaries, and automated templates.
Introduction

In today's fast‑paced digital landscape, agencies and freelancers are under constant pressure to deliver social media reporting that impresses clients while saving time. Manual report building can consume hours, leaving little room for strategic thinking. Enter SchedulifyX, an AI‑powered scheduling platform that integrates powerful analytics with automated report generation. This tutorial walks you through the exact steps to create professional client reports in under ten minutes, covering metric selection, data visualization, performance summaries, and seamless automated report creation. By the end, you'll have a repeatable workflow that turns raw data into compelling stories, all within the SchedulifyX dashboard.
Why Reporting Matters
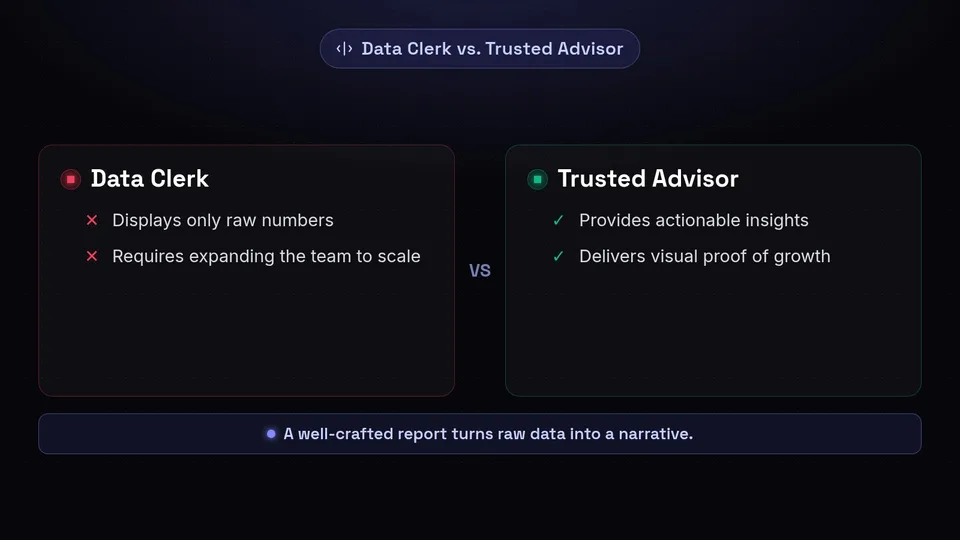
Effective social media analytics report does more than display numbers; it builds credibility, demonstrates ROI, and guides future strategy. Clients want to see:
- Clear evidence of campaign impact
- Actionable insights that inform next steps
- Visual proof of growth and engagement
When you can deliver these elements quickly, you position yourself as a trusted advisor rather than a data clerk. Moreover, rapid turnaround enables you to handle more clients without expanding your team, directly boosting profitability.
“A well‑crafted report turns raw data into a narrative that clients can act on.”
Metric Selection
Not all metrics are created equal. The key is to align the data you showcase with the objectives your client cares about. Below is a concise framework for choosing the right indicators.
Align Metrics With Goals
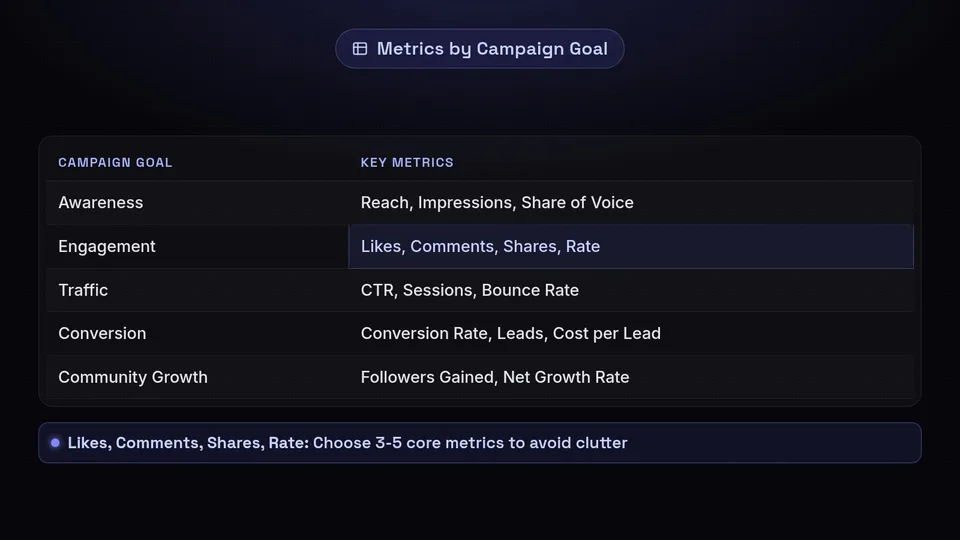
If a client’s primary goal is brand awareness, focus on reach and impressions. For conversion‑focused campaigns, prioritize click‑through rate (CTR), conversion rate, and cost per acquisition. Below is a quick reference table:
- Awareness: Reach, Impressions, Share of Voice
- Engagement: Likes, Comments, Shares, Engagement Rate
- Traffic: Click‑Through Rate, Sessions, Bounce Rate
- Conversion: Conversion Rate, Leads Generated, Cost per Lead
- Community Growth: Followers Gained, Net Growth Rate
Prioritize Quality Over Quantity
It's tempting to dump every available metric into a report, but clutter dilutes the message. Choose 3‑5 core metrics that best reflect the campaign’s success. This focus ensures the client report template remains concise and impactful.
Data Visualization
Visuals are the language of data. A well‑designed chart can convey complex trends in seconds. SchedulifyX offers a suite of visualization tools, but the principles of good design remain universal.
Choose the Right Chart Type
Bar charts excel at comparing discrete categories, line graphs illustrate trends over time, and pie charts work for proportional breakdowns — but use them sparingly. For time‑series data, a line graph with a clear baseline helps viewers spot spikes and dips instantly.
Apply Consistent Branding
Use the client’s brand colors or a neutral palette to maintain professionalism. Keep fonts legible, and avoid 3‑D effects that distort perception. SchedulifyX lets you save custom style presets, so you can apply a consistent look across all reports.
Label Clearly
Every axis, legend, and data point should be labeled. Add a concise title that tells the story at a glance. This practice reduces the need for explanatory text and makes the report self‑explanatory.
Performance Summaries
A performance summary synthesizes raw data into a narrative that highlights wins, uncovers opportunities, and outlines next steps. Structure your summary using the classic “Situation‑Action‑Result” (SAR) framework.
Executive Summary
Begin with a high‑level snapshot: total reach, engagement rate, and any standout achievements. Use bold or italic to emphasize key figures.
Key Wins
Highlight metrics that exceeded targets. For example, “Engagement rate surged 27% above the benchmark, driven by a viral video that garnered 150k views.” This section reinforces the client’s confidence in your strategy.
Areas for Improvement
Be transparent about under‑performing areas. Frame them as opportunities: “Organic reach fell short by 12%; we recommend increasing paid amplification to target look‑alike audiences.” Offer concrete recommendations rather than vague criticism.
Next Steps
Close with a clear action plan. List upcoming tests, content calendars, or optimization tactics. This forward‑looking approach demonstrates strategic thinking and keeps the client engaged.
Automated Report Generation
One of SchedulifyX’s standout features is its ability to generate reports automatically. Here’s how to leverage this power without sacrificing quality.
Create a Reusable Template
Start by designing a master template that includes your executive summary block, key wins section, and next‑step checklist. Insert placeholders for dynamic metrics that will be populated from the analytics engine. SchedulifyX allows you to save this template for future campaigns.
Link Data Sources
Connect your social accounts to SchedulifyX, then map each metric to its corresponding placeholder. The platform pulls data in real time, ensuring that every report reflects the latest figures.
Schedule Automated Delivery
Set up recurring email distributions to automatically send the completed report to clients on a predetermined schedule. You can also generate a PDF version for offline sharing. This hands‑off approach frees up valuable time for strategy work.
Step‑by‑Step: 10‑Minute Report
Now that you understand the components, let’s walk through the exact workflow that lets you produce a polished report in under ten minutes.
- Log In and Select a Project: Open SchedulifyX and choose the client’s social media project from the dashboard.
- Choose a Pre‑Built Template: Click “Report Template” and select the “Professional Social Media Report” template you saved earlier.
- Auto‑Populate Metrics: The system pulls the latest data for your chosen KPIs and fills the placeholders automatically.
- Customize Visuals: Apply the client’s brand colors, swap chart types if needed, and add any custom insights.
- Review and Add Narrative: Insert a brief executive summary (≈30 words) and highlight 2‑3 key wins using bold text.
- Generate PDF: Click “Export” and choose PDF format. The file is ready for distribution.
- Schedule Delivery: Set an automatic email to send the PDF to the client at 9 AM the next day.
By following these steps, you transform raw analytics into a client‑ready document in the time it takes to brew a coffee.
Client Communication Tips
Even the most beautiful report can fall flat if not communicated effectively. Consider these best practices:
- Tell a Story: Begin with the client’s goal, then walk them through the data journey.
- Use Plain Language: Avoid jargon; explain terms like “engagement rate” in simple words.
- Focus on Impact: Emphasize how the data influences business outcomes, not just numbers.
- Invite Dialogue: End with a question or invitation for feedback to keep the conversation open.
Remember, the ultimate goal is to make the client feel heard and confident in the direction you’re taking together.
Conclusion
Creating professional social media reporting no longer has to be a time‑consuming ordeal. With SchedulifyX’s AI‑driven analytics and automated report generation, you can deliver polished, data‑rich summaries in under ten minutes. This not only saves valuable hours but also elevates your client relationships by providing clear, actionable insights.
Ready to transform your reporting process? Sign up for SchedulifyX today and experience the power of instant, professional reports that drive client satisfaction and agency growth.