The Decision-First Guide to Social Media Analytics in 2026
SchedulifyX Team · September 3, 2026
Stop drowning in dashboards. Learn how to measure social media with metrics that drive decisions, untangle reach vs impressions, and prove genuine ROI.
Starting with Decisions, Not Dashboards

According to research from Aragile cited by Socialinsider on March 25, 2026, a staggering 70% of marketers cannot prove social media ROI to leadership without structured campaign analysis frameworks. This massive disconnect stems from a fundamental error in how modern marketing teams approach social media analytics: they start by opening a dashboard rather than starting with a business decision.
When you open a native analytics tab, you are instantly bombarded with charts, graphs, and percentage changes colored in bright green or alarming red. The platform's goal is to keep you looking at the dashboard. Your goal, however, should be to extract the exact data required to make a strategic choice. Are you trying to decide whether to increase your ad spend on Instagram Reels? Are you trying to determine if your LinkedIn content is actually reaching decision-makers? Are you choosing between a high-volume posting strategy or a low-volume, high-production strategy?
Without a clear decision in mind, metrics become mere decorations. As an analysis published by WION on July 26, 2026, brilliantly highlighted, there is a deep divide between narrative communication metrics and actual social media marketing. Aggregate view counts and algorithmic impressions frequently conflate mere exposure with genuine audience intent. A million views on a short-form video might build a narrative, but if those views do not translate into a measurable business outcome, they are vanity metrics. Learning how to measure social media requires a fundamental shift: you must identify the business question first, and only then seek the specific social media metrics that provide the answer.
Reach vs. Impressions: Untangling the Confusion
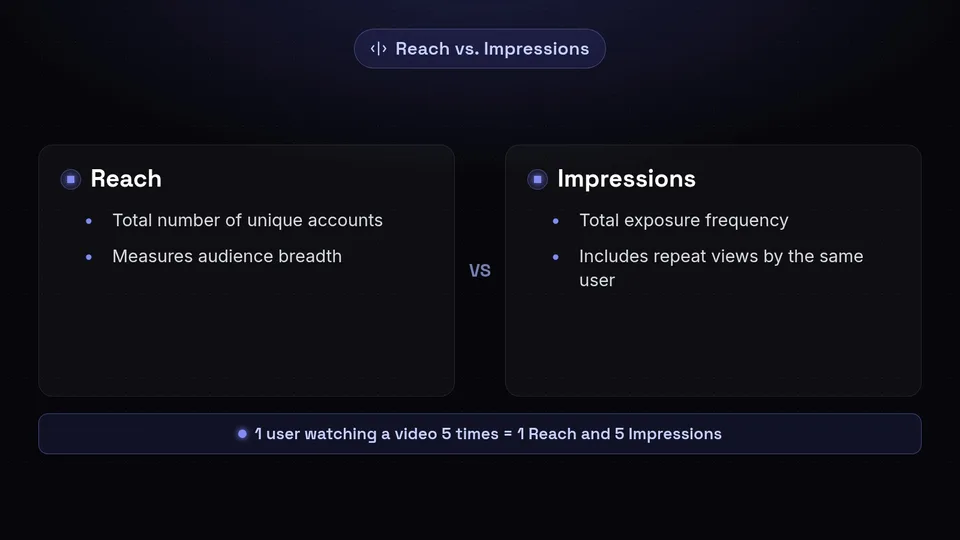
One of the most persistent areas of confusion in social media reporting is the difference between reach and impressions. They are routinely conflated, leading to wildly inaccurate assessments of brand awareness and campaign performance.
An influencer analytics guide published on August 2, 2026, provided a vital clarification of these terms. Reach measures audience breadth—it is the total number of unique accounts that have seen your content. Impressions measure total exposure frequency—this counts every single time your content is displayed on a screen, including repeat views by the same user. If one user watches your video five times, that counts as one reach and five impressions.
The Problem with Platform Estimates
While this distinction seems mathematically simple, the reality of platform reporting is far more complex. On August 14, 2026, industry analytics reporting detailed a crucial caveat: Instagram reach figures are actually platform estimates rather than absolute, hard counts. Because platforms process billions of data points daily, they use statistical sampling to estimate unique reach.
This means if you try to cross-reference reach data from the native Instagram app with data from a third-party dashboard, the numbers will almost never match perfectly. The actionable takeaway here is not to panic over minor discrepancies, but to track historical trends using a single reporting source to maintain consistency. If you use a dedicated platform reporting dashboard at /features/analytics, stick with it. Consistency in your data source is far more valuable than chasing a theoretically perfect absolute number.
Engagement Rate and the Denominator Problem
Engagement rate is widely considered one of the most critical social media KPIs. It tells you not just how many people saw your content, but how many cared enough to interact with it. However, calculating engagement rate introduces what data scientists call "the denominator problem."
To calculate an engagement rate, you divide total engagements (likes, comments, shares, saves) by a denominator. But what should that denominator be? If you divide by your total follower count, you are measuring engagement against your potential audience. If you divide by reach, you are measuring engagement against the unique users who actually saw the post. If you divide by impressions, you are measuring engagement against total views.
2026 Engagement Benchmarks
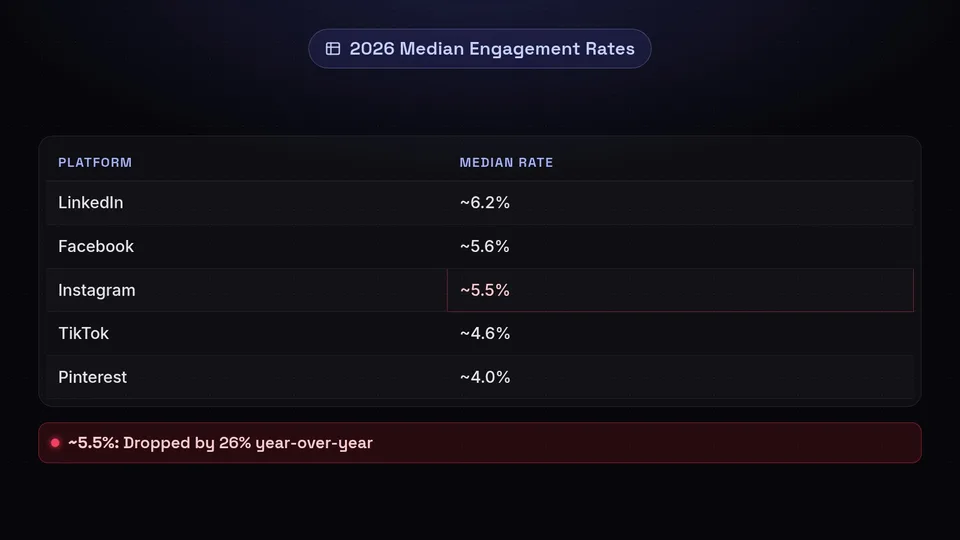
The denominator you choose drastically alters your perceived performance, making industry benchmarking difficult. Fortunately, on September 2, 2026, Buffer published updated research on platform median engagement rates (typically calculated using followers or reach, depending on the platform's API). Their findings reveal a rapidly shifting landscape:
- LinkedIn: ~6.2%
- Facebook: ~5.6%
- Instagram: ~5.5%
- TikTok: ~4.6%
- Pinterest: ~4.0%
- Threads: ~3.6%
- X (formerly Twitter): ~2.5%
Notably, year-over-year data showed that Instagram's engagement rate dropped by 26%, while X's engagement rate increased by an impressive 44%. This volatility proves why relying on a single metric is dangerous. To streamline this process and ensure you are calculating your metrics consistently, analytics workflows utilize dedicated utility pages like our /tools/engagement-rate-calculator, allowing you to easily toggle between followers, reach, or impressions as your denominator to get a true sense of your content's resonance.
The New Gold Standard: Saves, Shares, and Invisible Signals
For a decade, the "Like" button was the undisputed king of social media metrics. In 2026, a simple like is arguably the weakest form of engagement you can track. The algorithms have evolved to prioritize deep, intentional interactions over passive scrolling behavior.
The Power of the DM on Instagram
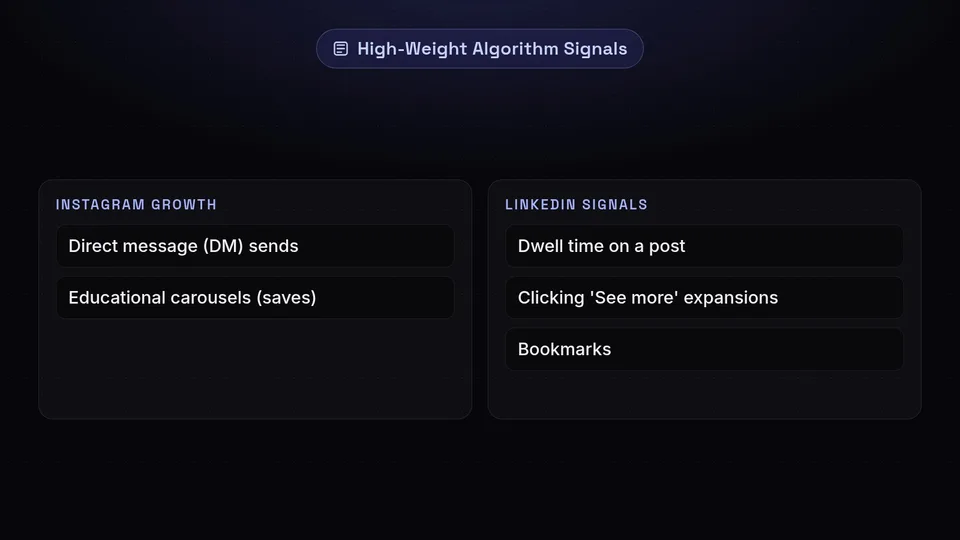
On July 24, 2026, Eclincher reported groundbreaking statements from Instagram head Adam Mosseri. Mosseri explicitly noted that direct message (DM) sends carry "roughly three to five times more weight than likes" when the algorithm evaluates whether to distribute your content to non-followers. This was further corroborated on August 7, 2026, when Biznex reported on the latest Instagram algorithm updates, confirming that DM shares and saves carry significantly more ranking weight than traditional likes.
What does this mean for your strategy? It means your content must be designed to be shared privately or saved for later utility. Educational carousels that users want to reference later (saves) and relatable memes or breaking news that users want to send to their friends (DM shares) are the new growth engines. To support this, Mosseri recommended a specific posting cadence for consistency: approximately two Reels and three to five feed posts per week.
Invisible Signals on LinkedIn
This shift toward deep intent is not limited to Instagram. On August 29, 2026, Ghost published a comprehensive guide on LinkedIn engagement mechanics. The guide revealed that LinkedIn's algorithm heavily prioritizes "passive/invisible quality signals." These include:
- Dwell time: How long a user pauses their scroll to look at your post.
- "See more" expansions: Clicking to read the rest of a long text post.
- Bookmarks: Saving the post for future reference.
These invisible signals are weighted far heavier than passive likes. If you are only looking at your like count to judge a LinkedIn post's success, you are missing the metrics that actually dictate algorithmic reach.
Attribution Limits: What Social Genuinely Cannot Prove
We must have an honest conversation about the limitations of social media analytics. As much as we want to track a user from their first impression of a tweet all the way to a finalized enterprise software purchase, the reality of digital privacy regulations, cross-device browsing, and platform walled gardens makes perfect attribution impossible.
Social media platforms are notoriously bad at proving bottom-of-the-funnel ROI natively. A user might see your Instagram Reel on their phone, remember your brand name, and then search for you on their work laptop two days later to make a purchase. In your analytics dashboard, that looks like a direct or organic search conversion, completely robbing social media of the credit it deserves.
Bridging the Gap with UTM Parameters
Because of these platform attribution limitations, you must take tracking into your own hands. This is where campaign URL parameters become essential. By appending specific tags to the links you share on social media, you force your website analytics (like Google Analytics) to recognize exactly where the traffic originated.
To maintain clean, organized data, you should always build your links using a standardized tool, such as our /tools/utm-builder. By consistently tagging the source (e.g., linkedin), medium (e.g., social), and campaign name, you can track website conversion paths much more accurately, giving you the hard data needed to prove ROI to leadership and solve the problem faced by the 70% of marketers mentioned earlier.
Benchmarking: Your Own History vs. Industry Averages
When marketers first dive into social media KPIs, their immediate instinct is to ask, "What is a good engagement rate in my industry?" While looking at the Buffer medians provided earlier is helpful for a macro-level view, obsessing over industry averages is a trap.
On March 15, 2026, Brandwatch updated its benchmarking taxonomy with a critical piece of advice: internal benchmarking provides vastly clearer performance signals than broad industry averages. Internal benchmarking means comparing your current performance against your organization's own historical data.
Why is this superior? Because industry averages include massive legacy brands with millions of followers, tiny startups, accounts that buy fake followers, and accounts with drastically different content budgets. Your only true competitor in analytics is your past self. Brandwatch recommends a review cadence of at least once per quarter to analyze these internal benchmarks. Did your Q3 engagement rate improve over your Q2 engagement rate? If yes, your strategy is working, regardless of what the "industry average" claims.
Choosing the Right Tools: Buffer vs. SchedulifyX
Executing a decision-first analytics strategy requires the right software. Many teams evaluate tools like Buffer and SchedulifyX to handle their scheduling and reporting needs.
On September 2, 2026, Buffer released its "11 Best Social Media Analytics + Reporting Tools in 2026." In their breakdown, they noted their own pricing model: basic 30-day analytics are offered on a free tier, while access to custom historical data and reporting exports requires paid plans starting at $6 per month (as of September 2, 2026).
To be completely transparent, Buffer is stronger than SchedulifyX for absolute beginners or solopreneurs who operate on a zero-dollar budget and only need a basic 30-day lookback window. Their free tier is highly accessible for those just starting out.
However, if you are part of a growing team that needs to align social media metrics with deep business decisions, SchedulifyX provides a more robust, AI-powered infrastructure. Our analytics suite focuses heavily on custom historical benchmarking and predictive algorithmic insights, allowing you to track those invisible signals and DM shares with granular precision. (Note: Software pricing and plan limits change frequently; always confirm current details on the vendor's own pricing page.)
How to Build a Report Someone Will Actually Read
The final step in mastering how to measure social media is communication. You can have the most accurate data in the world, but if you present it poorly, leadership will ignore it.
To build a social media report that actually gets read, follow this structure:
- Start with the Bottom Line (TL;DR): Do not start with follower growth. Start with business impact. "This month, social media drove 5,000 in attributed pipeline, a 12% increase from last month."
- Highlight the 'Why': If Instagram reach dropped, explain why. Reference the August 14th data about platform estimates, or explain that you shifted strategy from high-volume feed posts to high-quality Reels.
- Showcase the Invisible Signals: Educate your stakeholders. Show them that while likes may be down, "See more" clicks on LinkedIn are up 40%, indicating higher quality engagement from your target audience.
- End with Recommendations: Data without action is useless. Conclude your report with "Because of X data point, we are making Y decision next month."
Conclusion: Transforming Data into Strategy
Social media analytics should never be a passive exercise in admiring charts. By understanding the critical difference between reach and impressions, recognizing the massive algorithmic weight of saves and DM shares, properly utilizing UTM parameters to track conversions, and benchmarking against your own historical data, you transform raw numbers into actionable business intelligence.
Stop letting vanity metrics dictate your strategy. Start making data-driven decisions that actually impact your bottom line. Ready to upgrade how your team measures success? Explore our advanced reporting capabilities at SchedulifyX and turn your social data into your strongest competitive advantage.
Sources
Facts checked against the sources below on September 3, 2026.
- Social Media Engagement Guide — buffer.com
- Best Social Media Analytics Tools — buffer.com
- What Is Linkedin Engagement 2026 Guide — linkmate.ghost.io
- Social Media Numbers Never Match — vistasocial.com
- Instagram Caption Gets Saves Shares — biznex.app
- Influencer Reach Vs Impressions Guide — influencerfee.com
- How The Instagram Algorithm Works In 2026 — eclincher.com
- Narrative Communication Beyond Social Media Views And Impressions 1785040523333 — wionews.com
- Campaign Performance Analysis — socialinsider.io
- Social Media Benchmarking — brandwatch.com