Ultimate Guide to TikTok Analytics: Metrics That Matter
SchedulifyX Team · August 26, 2026
Master TikTok analytics in 2026. Learn how to see your TikTok insights, which metrics predict viral distribution, and how to read audience retention graphs.
In the fast-paced world of short-form and increasingly long-form video, creating engaging content is only half the battle. The other half is understanding the science behind content distribution. If you want to grow your audience, you need to master TikTok analytics. Understanding your data is the only reliable way to move away from guessing what your audience wants and move toward a predictable, data-driven content strategy.
As the platform evolves, so do the signals that determine whether your video reaches ten people or ten million. With recent updates in 2025 and 2026, the algorithm has shifted its priorities. Knowing how to see TikTok analytics and, more importantly, knowing how to interpret your TikTok insights is what separates casual creators from industry-leading brands.
This comprehensive guide will walk you through everything you need to know about TikTok metrics today. We will cover exactly where to find your dashboards, which specific metrics actually predict algorithmic distribution, how to read your retention graphs, and which vanity metrics you should completely ignore. Let us dive into the data.
Recent Platform Updates and the 2026 Algorithm
Before diving into individual metrics, it is crucial to understand the current landscape of the platform. TikTok is not the same app it was a few years ago, and the data points the algorithm values have shifted significantly. To truly leverage your TikTok insights, you must contextualize them within the platform's latest updates.
The Shift Toward Watch Time and Longer Formats
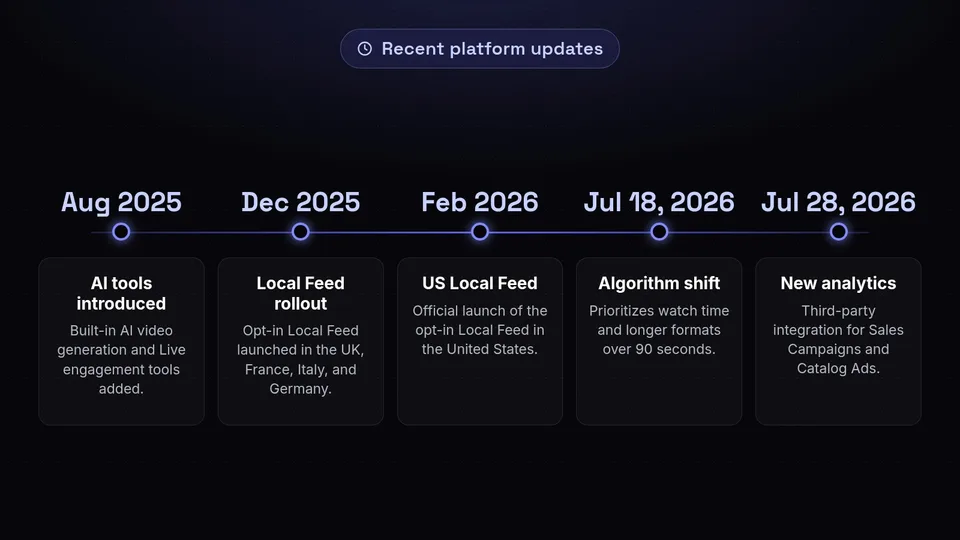
According to algorithm analyses published by InfluenceFlow on July 18, 2026, TikTok's distribution model has undergone a noticeable transformation. The platform now heavily prioritizes watch time and completion rates, specifically favoring longer-form video formats—particularly those over 90 seconds. This is a massive shift from the early days of 15-second trending dances. The algorithm is currently optimized to keep users on the app for as long as possible, meaning creators who can hold attention for a minute and a half or more are rewarded with disproportionate reach.
Furthermore, this update explicitly reduced the algorithm's reliance on raw follower counts. This means that a brand-new account with zero followers has a nearly equal opportunity to go viral as an account with millions of followers, provided the content generates the right engagement signals from its initial test audience.
New Analytics and Measurement Capabilities
On July 28, 2026, via the TikTok Product Preview for Q3 2026, the platform announced powerful new measurement and analytics capabilities. For businesses running paid campaigns alongside their organic efforts, TikTok introduced a highly anticipated third-party Google Analytics integration specifically for Sales Campaigns and Smart+ Catalog Ads. They also announced expanded Pulse capabilities and new AI-driven creative tools, building upon the built-in AI video generation features and TikTok Live engagement tools that were previously introduced on August 8, 2025.
The Local Feed Expansion
Another critical update impacting how you analyze traffic sources is the introduction of the Local Feed. Following a successful December 2025 rollout in the UK, France, Italy, and Germany, TikTok officially launched its opt-in Local Feed in the United States on February 11, 2026, for users aged 18 and older. This feed is designed to track and promote local content discovery, adding a new layer of geographic relevance to your TikTok metrics.
How to See TikTok Analytics: Accessing Your Dashboard
If you are wondering how to see TikTok analytics, the process is straightforward, but it requires the right account setup. Standard personal accounts do not have access to in-depth data. To unlock your TikTok insights, you must be using a free Creator or Business account. If you are currently on a personal account, you can easily switch by navigating to your profile, tapping Settings, selecting Account, and choosing the option to switch to a Business or Creator account.
Once your account is properly configured, you can access your data across different devices and at different levels of granularity.
Accessing Analytics on the Mobile App
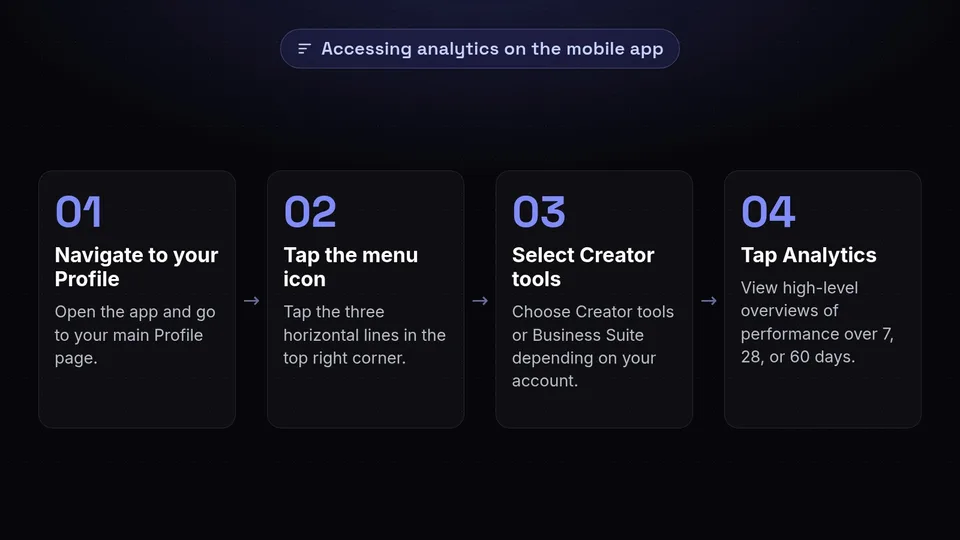
For on-the-go monitoring, the mobile app provides a robust overview of your performance. To find it:
- Navigate to your Profile page.
- Tap the menu icon (the three horizontal lines, ☰) in the top right corner.
- Select Creator tools or Business Suite (depending on your account type).
- Tap Analytics.
Here, you will find high-level overviews of your account's performance over the last 7, 28, or 60 days, including overall views, follower growth, and profile views.
Accessing Analytics via Desktop (TikTok Studio)
For a deeper dive into your TikTok metrics, the desktop experience is highly recommended. The larger screen makes it much easier to read retention graphs and export data for your team.
- Open your web browser and navigate to studio.tiktok.com.
- Log into your account.
- Select Analytics from the left-hand navigation menu.
TikTok Studio provides a more expansive view of your data, making it ideal for monthly reporting and deep-dive strategy sessions.
Viewing Single-Video Analytics
While account-wide data is helpful for spotting macro trends, the real goldmine for content strategy lies in single-video analytics. Because the algorithm evaluates videos individually rather than judging your account as a whole, you need to know how each specific piece of content performed.
- Open any published video directly on your profile.
- Tap the three-dot menu icon (···) on the right side of the screen.
- Select Analytics (often represented by a small graph icon).
This will open a dedicated page showing the specific retention graph, traffic sources, and engagement metrics for that single video.
Metrics That Predict Algorithmic Distribution
Not all TikTok metrics are created equal. When you look at your dashboard, you will see a sea of numbers, but only a select few actually dictate whether the algorithm will push your video to the masses. The TikTok algorithm works in stages: it shows your video to a small test group of users. If that group sends positive signals, it pushes the video to a larger group, and so on. Here are the precise metrics that act as the strongest positive signals.
Video Completion Rate (Watched Full Video %)
The Video Completion Rate is arguably the most critical metric for algorithmic success. In your analytics, this is often labeled as "Watched Full Video %." It is calculated with a simple formula: (Completed Views / Total Views) × 100.
Why does this matter so much? Because a high completion rate proves to the algorithm that your content is captivating enough to hold a user's attention from the very first frame to the very last. It is the ultimate indicator of content quality. Data shows that achieving a completion rate between 50% and 70% (or higher) within your initial test user groups is a massive signal of quality. When the algorithm sees these numbers, it almost always triggers broader distribution to For You pages worldwide.
Average Watch Time vs. Total Play Time
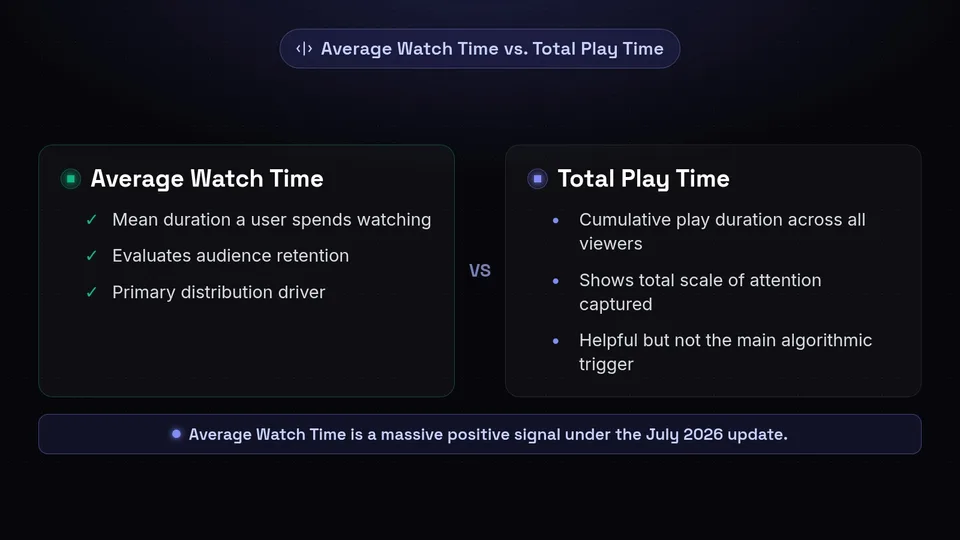
When analyzing how long people spend watching your content, TikTok provides two distinct metrics: Average Watch Time and Total Play Time. Understanding the difference between these two is vital for interpreting your TikTok insights accurately.
- Average Watch Time: This represents the mean duration a user spends watching a specific video. This is considered a primary distribution driver because it evaluates audience retention relative to the actual length of the video. For instance, if you have a 90-second video and your Average Watch Time is 45 seconds, you are retaining users for 50% of a long-form video, which is a massive positive signal under the July 2026 algorithm update.
- Total Play Time: This is the cumulative play duration across all viewers combined (e.g., "Your video was watched for a total of 500 hours"). While this metric is fantastic for understanding the total scale of attention you have captured—and is great for sponsor pitch decks—it is not considered a primary distribution signal by the algorithm compared to average watch time.
High-Intent Engagements: Shares and Saves
For years, marketers focused on getting as many "likes" as possible. However, the algorithm has evolved to prioritize high-intent engagements. Specifically, Shares and Saves act as incredibly strong demand and distribution signals.
When a user saves a video, they are telling the algorithm, "This content is so valuable, educational, or entertaining that I need to return to it later." When a user shares a video (either via direct message or to another platform), they are doing the algorithm's job for it by distributing the content to new users. These actions outrank passive likes by a wide margin because they indicate high value or viral potential.
If you want to easily audit your engagement calculations across different videos, you can use our engagement rate calculator or evaluate broader dashboard views via our detailed analytics features.
Traffic Source Breakdown and the For You Percentage

Understanding where your viewers are coming from is just as important as knowing how many viewers you have. TikTok categorizes view origins into several distinct traffic sources: "For You", "Following", "Personal Profile", "Search", "Sound", and "Hashtag". Analyzing this breakdown tells you exactly how the algorithm is treating your content.
Decoding a High "For You" Percentage
The "For You" page (FYP) is the holy grail of TikTok distribution. If you look at your single-video analytics and see a High "For You" percentage (e.g., 80% to 95% of your traffic is coming from the FYP), it indicates that the algorithm is actively serving your video to new, non-follower audiences. This happens because your initial performance test signals—your completion rate, average watch time, shares, and saves—were strong enough to warrant algorithmic expansion. A high FYP percentage is the clearest sign that your content strategy is working perfectly for audience acquisition.
Decoding a High "Following" or "Profile" Percentage
Conversely, if you notice a high "Following" or "Personal Profile" percentage, it indicates that your reach is mostly limited to your existing follower base or to users who manually visited your profile. While this isn't inherently bad—it means your existing community is engaged—it does mean that the video failed to generate the necessary algorithmic signals to break out into the broader FYP ecosystem. If you consistently see low FYP percentages, you need to re-evaluate your hooks and retention strategies.
The Impact of Search and Local Discovery
With TikTok increasingly functioning as a search engine, the "Search" traffic source is becoming more prominent. Optimizing your on-screen text, captions, and spoken words for SEO can drive steady, evergreen traffic through search. Additionally, with the rollout of the Local Feed in the US and Europe throughout 2025 and 2026, location-based tagging has become a more viable strategy for local businesses looking to dominate regional traffic sources.
Retention Graphs: Reading the Drop-Offs
If you want to truly master TikTok metrics, you must become comfortable reading the Audience Retention Graph. Available in TikTok Studio and on single-video analytics, this graph displays a second-by-second percentage curve of remaining viewers across your video's timeline. It is the most brutally honest feedback mechanism available to creators.
The First 1–3 Seconds Drop-Off: The Hook
The most critical part of the retention graph is the very beginning. A steep initial drop—for example, greater than a 30% decline in the first 3 seconds—signals a weak hook or a slow visual intro. Users on TikTok swipe fast. If you spend the first three seconds introducing yourself, clearing your throat, or showing a static image, the audience will leave. To fix a steep early drop-off, ensure your videos start with immediate action, compelling visual movement, or a bold on-screen text statement that introduces the value proposition of the video instantly.
Mid-Video Dips: Pacing and Pacing
As you follow the curve of the graph, you might notice sudden mid-video dips. These dips indicate exactly where viewers lost interest and swiped away. This usually points to weak pacing, boring segments, long pauses, or unexpected shifts in the topic. When you identify a mid-video dip, look at the exact second it occurred in the video. Did you stop talking? Did the music cut out? Did you go off on a tangent? Use this data to ruthlessly edit your future videos, cutting out the fluff that causes these drop-offs.
Tail Spikes: The Power of Loops
Occasionally, you will see a spike near the very end of the retention curve. Tail spikes indicate that viewers are looping, rewinding, or rewatching the end of the video. This often happens if there is a fast transition that loops seamlessly back to the beginning, or if there is a dense piece of text on the screen at the very end that users have to rewatch to read fully. Because total completion rate and average watch time are so important, engineering your videos to encourage these tail spikes and loops is a highly effective tactic for boosting algorithmic distribution.
Understanding Follower Demographics and Activity Times
Creating great content is only effective if it reaches the right people at the right time. Your TikTok insights provide a wealth of demographic data that can help you tailor your content and publishing schedule.
Follower Activity Times
Found in the Followers analytics tab, the Follower Activity metric tracks the specific days and hours when your follower base is most active online. Because the algorithm relies heavily on the initial performance of a video when it is first posted, publishing your content right before your audience's peak activity window ensures it gets immediate engagement. If your data shows your audience is most active at 7:00 PM on Thursdays, posting at 6:30 PM gives your video the best chance of capturing that initial wave of high-intent engagement.
Demographic Breakdowns
The analytics dashboard also displays crucial demographic breakdowns, including age, gender, and regional/country distributions. This data is essential for confirming if your content is actually reaching your target audience. For example, if you are a local real estate agent in Texas but your demographic data shows that 80% of your audience is based in the UK, your content strategy is misaligned with your business goals. You would need to pivot to more localized content, perhaps leveraging the new Local Feed features, to correct this demographic skew.
Vanity Metrics to Ignore
In the world of social media, it is incredibly easy to get distracted by big numbers that don't actually matter. When analyzing your TikTok metrics, you must learn to separate actionable data from vanity metrics. Focusing on the wrong numbers will lead your strategy astray.
Raw Video View Count
It sounds counterintuitive, but raw video view counts are largely a vanity metric if they are not backed up by retention data. High view counts without strong average watch time or completion rates simply indicate passive impressions rather than a genuine audience connection. A video might get pushed to the FYP briefly, rack up 10,000 views, but if everyone swipes away after two seconds, those views are worthless to your brand and will not result in long-term account growth.
Passive Likes
As mentioned earlier, likes are the easiest form of engagement to give. A user can double-tap a video without even fully processing what they watched. Consequently, passive likes carry significantly less algorithmic weight for distribution than completion rate, comments, shares, or saves. Do not judge the success of a video solely based on its like-to-view ratio.
Total Follower Count
Perhaps the biggest shift in the modern social media landscape is the devaluation of the follower count. Because the algorithm evaluates individual video completion and retention metrics over account size, your total follower count is effectively a vanity metric. Accounts with low follower counts can still achieve wide viral reach. Do not be discouraged if your follower growth is slow; focus entirely on the retention and engagement metrics of your individual videos, and the reach will follow.
Native TikTok Analytics vs. Third-Party Tools
When it comes to managing your data, you have a choice between relying solely on TikTok's native analytics and utilizing third-party social media management platforms like SchedulifyX.
It is important to be transparent: as of August 26, 2026, TikTok's native TikTok Studio is stronger than SchedulifyX in certain specific, highly granular areas. Because TikTok owns the data pipeline, their native UI offers hyper-granular, second-by-second audience retention graphs that are incredibly precise for single-video analysis. Furthermore, if you are running paid media, TikTok's native platform is the only place to access the newly announced (July 28, 2026) third-party Google Analytics integration specifically tailored for Sales Campaigns and Smart+ Catalog Ads.
However, where SchedulifyX excels is in cross-platform holistic strategy. If you are a brand or agency managing TikTok alongside Instagram, YouTube Shorts, and LinkedIn, logging into individual native studios is incredibly inefficient. SchedulifyX allows you to schedule your content, track macro-level engagement trends, and calculate cross-platform performance seamlessly in one dashboard. You can utilize our analytics suite to get a unified view of your brand's total social footprint, saving hours of manual data entry.
Note: Pricing, plan names, and feature limits for third-party integrations change frequently; always confirm current capabilities directly on the vendor's own page.
Conclusion and Next Steps
Mastering TikTok analytics is not a one-time task; it is a continuous process of hypothesis, testing, and measurement. By understanding how to see TikTok analytics and focusing on the TikTok metrics that actually drive distribution—like completion rate, average watch time, and high-intent shares—you can engineer content that the algorithm wants to promote.
Stop obsessing over vanity metrics like raw views and follower counts. Instead, dive deep into your retention graphs, fix your initial 3-second hooks, and optimize your posting schedule based on your follower activity times. The data is all there waiting for you to use it.
Ready to take your social media strategy to the next level? Stop juggling multiple native apps and start streamlining your workflow. Dive into your data, schedule your optimized content, and grow your audience faster with SchedulifyX.
Sources
Facts checked against the sources below on August 26, 2026.
- Tiktok Product Preview — ads.tiktok.com
- Tiktok Algorithm Updates 2026 Master Your For You Page Strategy — influenceflow.io
- disruptmarketing.co
- socialbee.com
- multilogin.com
- Tiktok Metrics Organic — swydo.com
- Tiktok Analytics Guide Creators — brandghost.ai
- later.com
- Tiktok User Analytics Metrics That Predict Your Next Viral — tokportal.com
- printify.com