Finding Your True Best Times to Post on Instagram in 2026
SchedulifyX Team · October 6, 2026
Stop relying on universal averages. Learn how to run a four-week test using native Instagram Insights to find the exact posting times that work for your unique audience.
Every social media manager has asked the same question: when exactly should I hit publish to maximize engagement? A quick search will yield dozens of conflicting charts, graphs, and industry reports claiming to have unlocked the universal secret to the algorithm. However, the reality of modern social media management is far more nuanced. While aggregate industry data provides an excellent starting point, relying solely on broad averages is a surefire way to leave engagement on the table.
To truly master your content strategy, you must move past published averages and dive deep into your own audience's data. This comprehensive guide will explore exactly where Instagram Insights shows follower active times, how to interpret that data correctly, why relying on a single week of analytics is fundamentally misleading, and how to execute a rigorous four-week test to discover your account's true peak posting windows.
The Myth of Universal Averages: Why Broad Data is Just a Hypothesis
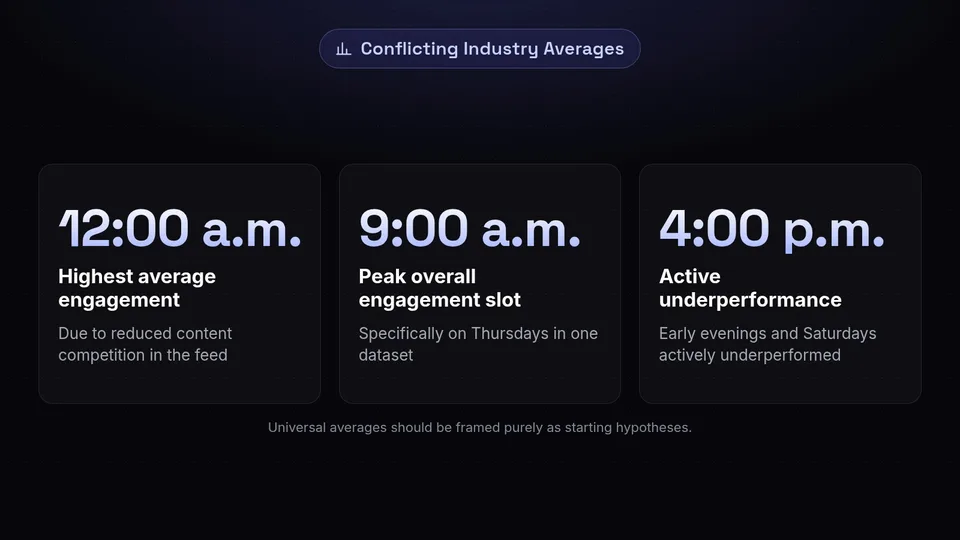
Before we dive into your custom analytics, it is vital to understand the role of aggregate data in social media strategy. Large-scale studies are incredibly valuable, but they represent a blend of millions of disparate accounts across countless time zones, niches, and audience demographics. According to a research update from Donivo (as of August 27, 2026), platform benchmarks—specifically weekday mornings between 7:00 a.m. and 9:00 a.m., and lunch periods between 11:00 a.m. and 1:00 p.m., Tuesday through Friday—should be framed purely as starting hypotheses. They are not universal laws; they are baseline theories to be verified against your individual account data.
Consider the massive variance in recent industry findings. A comprehensive study by Dash Social (as of September 1, 2026) analyzed 2.2 million Instagram assets, encompassing over 750,000 posts from 1,549 brands, 323,000 Reels, and 1.2 million Stories between July 2025 and June 2026. Their data indicated that 12:00 a.m. local time achieved the highest average engagement due to significantly reduced content competition in the feed. Conversely, early evenings (4:00 p.m. to 7:00 p.m.) and Saturdays at 4:00 p.m. actively underperformed in their dataset.
Meanwhile, an extensive update from Buffer (as of September 23, 2026) analyzed 9.6 million Instagram posts and identified entirely different peak overall engagement slots: Thursday at 9:00 a.m., Wednesday at 12:00 p.m., and Wednesday at 6:00 p.m. local time.
Which study is right? The answer is both—for their specific datasets. This is exactly why a strategy guide published by HubSpot (as of August 25, 2026) strongly recommends using these platform-wide averages merely as initial hypotheses. To find what works for you, you must test these windows against your own follower behavior. If you need a comprehensive look at these aggregate baselines to form your initial theories, you can review the published windows before moving on to the personalized testing protocol outlined below.
Navigating Native Instagram Insights: Finding Follower Active Times
The first step in moving from aggregate data to personalized strategy is understanding how to access and read native Instagram Insights. Many marketers look at their overall engagement metrics but fail to isolate the specific times their unique audience is actually logging into the app.
According to a platform breakdown by Social Champ (as of August 20, 2026), navigating to your follower timing data is straightforward but hidden a few taps deep. To find it, open the Instagram app and navigate to your profile. Tap on the "Professional Dashboard", then select "Total Followers", and scroll down to the "Most Active Times" section.
Understanding the "Hours" vs. "Days" Toggle
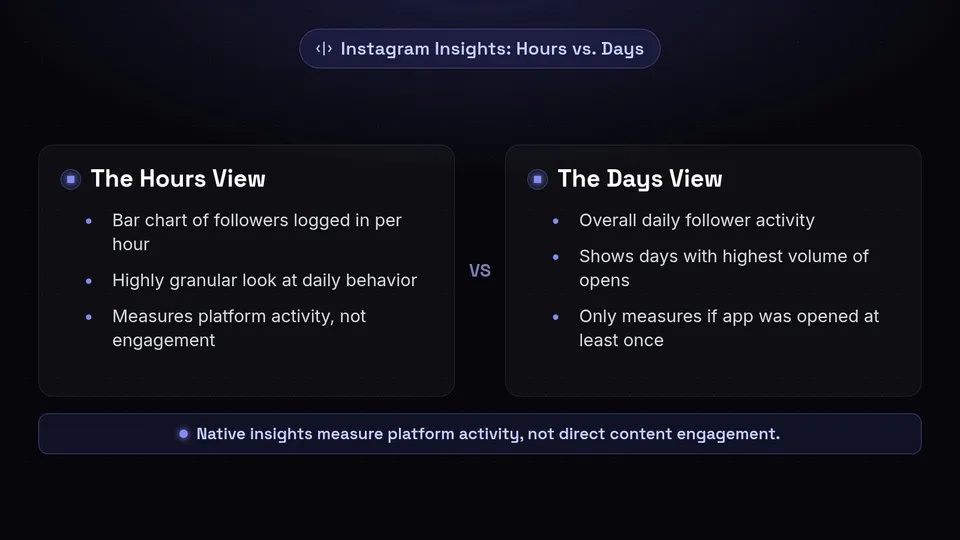
Once you are in the "Most Active Times" section, you will notice a toggle that allows you to switch between "Hours" and "Days." Understanding the distinction between these two views is critical for accurate data interpretation.
- The "Hours" View: This displays a bar chart representing the average number of your followers who are logged into the app per hour for a selected day. It is a highly granular look at daily behavior.
- The "Days" View: This shows overall daily follower activity, helping you understand which days of the week have the highest volume of your audience opening the app at least once.
Crucial Caveat: As noted in the Social Champ breakdown, this native feature measures platform activity (when your followers are simply opening the app), rather than direct content engagement (when they are actively liking, commenting, or saving). Just because your audience is online does not guarantee they are in the mood to engage with your specific type of content. This is why native insights are only the first piece of the puzzle.
Why a Single Week of Data Will Mislead You

A common mistake social media managers make is checking their "Most Active Times" on a Friday, noting a spike at 3:00 p.m., and deciding that 3:00 p.m. is their permanent posting slot. Relying on a single week of data is a recipe for strategic failure.
Audience behavior is not static. According to a guide published by CreatorFlow (as of September 24, 2026), marketers must review native Instagram Insights on a monthly basis to adjust their posting schedules for seasonal audience drift and cultural events. A single week of data might be skewed by a national holiday, a major news event, a viral trend, or even severe weather in a region where a large portion of your audience resides.
For example, during the summer months, your audience might stay offline longer in the evenings, shifting their active hours later into the night. During the back-to-school season, morning commute times might suddenly see a massive spike in activity. If you base your entire quarterly strategy on one anomalous week in August, your September engagement will plummet. You need statistical reliability, which requires a longer testing horizon.
The Four-Week Testing Protocol: Finding the Real Answer
If universal averages are just hypotheses, and a single week of native data is too volatile to trust, how do you find the definitive answer? You run a controlled, scientific test over a statistically significant period.
An analysis by the TAMEYO Group (as of September 6, 2026) states that testing individual posting time slots requires a minimum four-week evaluation period. For accounts publishing fewer than three times weekly, you need a minimum of 12 posts per time window. Smaller sample sizes yield data that is simply too thin to be statistically reliable. Similarly, HubSpot's strategy guide (August 25, 2026) advises brands to run 4- to 6-week tests to generate actionable insights.
Here is the exact protocol for executing this four-week test:
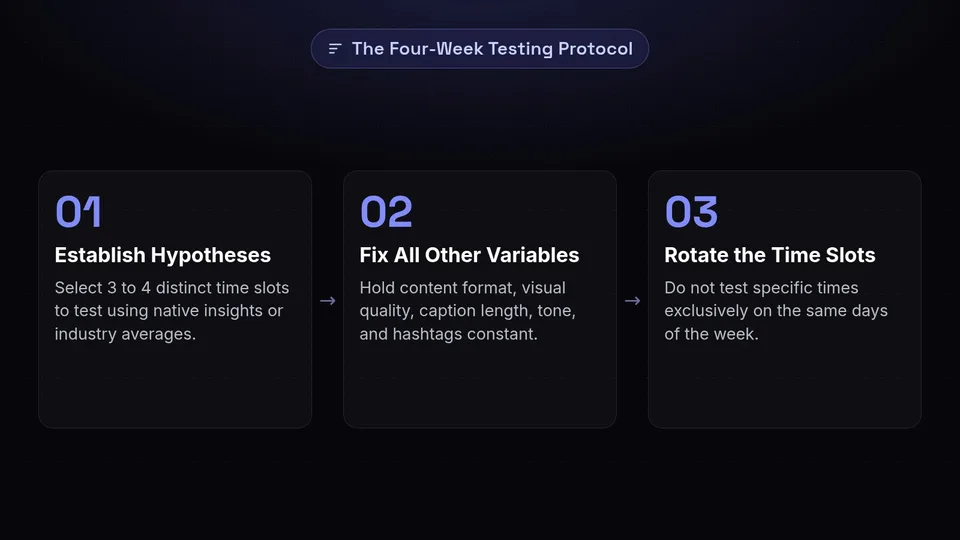
Step 1: Establish Your Hypotheses
Select 3 to 4 distinct time slots to test. You can pull these from your native "Most Active Times" chart, or use the industry averages mentioned earlier (e.g., the Dash Social 12:00 a.m. low-competition slot, or the Buffer 9:00 a.m. high-activity slot). Remember to account for where your audience lives; if you have a global audience, use a timezone conversion tool to ensure your local posting time aligns with their waking hours.
Step 2: Fix All Other Variables
This is the most critical step, and where most marketers fail. To test the efficacy of a time slot, time must be the only variable that changes. You must hold all other post variables constant. If you post a highly produced Reel on Monday at 9:00 a.m. and a low-effort graphic on Tuesday at 6:00 p.m., you cannot blame the time slot for the graphic's poor performance.
During your four-week test, ensure the following remain consistent across the slots you are testing:
- Content Format: Compare Carousels to Carousels, and Reels to Reels.
- Visual Quality: Maintain a consistent aesthetic and production value.
- Caption Length and Tone: Keep your copywriting style uniform.
- Call to Action: Use similar CTAs (e.g., asking a question vs. directing to a link in bio).
- Hashtag Clusters: Use the same volume and niche relevance of hashtags.
Step 3: Rotate the Time Slots
Do not test 9:00 a.m. exclusively on Mondays and 6:00 p.m. exclusively on Fridays. Day-of-the-week behavior varies wildly. Instead, rotate your chosen time slots across different days throughout the four-week period. This ensures that the performance of the 9:00 a.m. slot is evaluated independently of the "Monday effect."
Step 4: Evaluate Engagement Rate Changes
After four weeks (or 12 posts per window for lower-volume accounts), evaluate the changes in your engagement rate. Do not just look at vanity metrics like total likes. As highlighted by a Vismore cross-study report (as of July 20, 2026), which synthesized datasets from over 9.6 million posts, you must track saves and Direct Messages (DMs) as your primary algorithm signals. A time slot that generates fewer likes but significantly more saves and DMs is highly valuable for long-term algorithmic growth.
Matching Content Formats to Time Windows
As you refine your strategy, you will discover that the best times to post on instagram often depend heavily on the type of content you are publishing. Audience intent shifts throughout the day.
The Vismore report (July 20, 2026) advises cross-referencing your "Most Active Times" with content format windows. Their synthesized data suggests that morning hours are typically better suited for Carousel posts, as users are commuting or starting their workday and prefer easily digestible, swipeable information.
Conversely, video content requires a different mindset. Buffer's massive 9.6 million post analysis (September 23, 2026) found that evening hours—specifically between 6:00 p.m. and 11:00 p.m. local time—perform best for Instagram Reels. During these hours, users are off the clock, relaxing at home, and more willing to turn their sound on and passively consume short-form video content. When planning your four-week test, consider testing your Reels exclusively in these evening windows to gauge your audience's video consumption habits.
Day-by-Day Hypotheses for Your Testing Framework
While we have established that you must rely on your own data, it is helpful to structure your four-week test around specific daily hypotheses based on recent 2026 data trends. Here is how you might approach different days of the week.
The Start of the Week
When determining the best time to post on instagram monday, consider the psychology of your audience. Mondays are typically high-stress, transition days. Users are catching up on emails and planning their week. Morning slots (like the 7:00 a.m. to 9:00 a.m. window suggested by Donivo) can catch users during their commute, but engagement might be passive (scrolling without interacting). Testing a lunch-hour slot (12:00 p.m.) on Monday often yields better active engagement as users take their first real mental break of the week.
The Mid-Week Low Competition Strategy
Finding the best time to post on instagram tuesday presents a unique opportunity for experimentation. Recall the Dash Social study (September 1, 2026), which found that Tuesday at 12:00 a.m. achieved the highest average engagement across their 2.2 million asset dataset. Why? Reduced competition. Most brands are asleep and their scheduling queues are empty. If your audience has night owls, or if you have an international following, testing a late-night or extremely early morning Tuesday slot could place your content at the top of the feed when users wake up, facing very little competitor noise.
The Weekend Dynamic
The weekend requires a completely different approach. The best time to post on instagram sunday is rarely during standard business hours. On Sundays, user routines are unpredictable. They sleep in, run errands, or spend time with family. Late Sunday evenings (between 7:00 p.m. and 9:00 p.m.) often serve as a prime testing window. Users are winding down from the weekend and preparing for the week ahead, leading to a surge in "doom-scrolling" and passive content consumption—making it an excellent window for testing Reels.
The Competitor Landscape: Automation and Data Modeling
Executing a rigorous four-week test manually requires immense discipline. Unsurprisingly, the social media software industry has developed various automated solutions to help brands identify their peak posting times based on historical data.
As of September 23, 2026, Buffer updated its native scheduling feature to include automated posting slots directly populated from their 9.6 million post dataset. Users can navigate to "Manage Posting Times" > "Generate New Posting Slots" > "Use Recommended Times" to leverage this aggregate data directly in their queue.
For deep, account-specific historical modeling, legacy enterprise platforms have developed sophisticated tools. As of July 14, 2026, Hootsuite highlighted its "Perch by Hootsuite" heatmap integration, which features a "Best Time to Publish" and "Recommended Times in Composer" tool that computes personalized posting windows based on an account's specific follower engagement history. Similarly, as of March 31, 2026, Sprout Social utilizes its patented "ViralPost" technology to automatically calculate active follower hours and schedule posts during account-specific peak engagement windows.
While SchedulifyX provides robust, AI-driven scheduling workflows and intuitive analytics designed for rapidly growing brands and agile marketing teams, we readily concede that for massive enterprise organizations requiring patented historical data modeling and decade-deep legacy heatmapping, Sprout Social’s ViralPost technology and Hootsuite’s Perch integration are stronger, more established legacy solutions for deep historical data extrapolation. They excel at processing years of historical account data for massive global teams.
Please note that platform features, naming conventions, and pricing models change frequently across the SaaS industry; always confirm current capabilities and structures directly on the respective vendor's website.
Conclusion: Take Control of Your Posting Strategy
The search for the definitive best time to post on Instagram will never end, simply because the answer is constantly evolving. Aggregate studies from industry leaders provide an excellent foundation, helping you understand broad platform trends like the dominance of evening Reels or the low-competition advantage of midnight posting. However, these are just the starting lines.
True algorithmic success comes from moving past published averages and embracing your own data. By understanding how to navigate native Instagram Insights, recognizing the volatility of single-week data, and committing to a rigorous, variable-controlled four-week testing protocol, you can uncover the exact windows where your unique audience is most primed to engage, save, and share your content.
Stop guessing and start testing. Let the data dictate your strategy, and watch your engagement metrics transform. If you are ready to streamline your testing protocol, seamlessly rotate your posting slots, and analyze your growth without the manual headache, try SchedulifyX today to bring AI-powered precision to your social media calendar.
Sources
Facts checked against the sources below on October 6, 2026.
- When Is The Best Time To Post On Instagram — buffer.com
- Best Times Post Instagram — creatorflow.so
- Best Time To Post On Instagram — tameyogroup.com
- Best Time To Post On Instagram — dashsocial.com
- donivo.app
- Instagram Best Time Post — blog.hubspot.com
- Best Time To Post On Instagram — socialchamp.com
- When To Post On Instagram — elementor.com
- Best Time To Post On Reddit Instagram — vismore.ai
- Best Time To Post On Instagram — blog.hootsuite.com