A Practical Introduction to Social Media Analytics
Discover a practical introduction to social media analytics. Learn how to track engagement, interpret data, and optimise your strategy with SchedulifyX.
SchedulifyX is the AI-powered social media command center built for creators, businesses, and agencies. Schedule posts across 10+ platforms, generate content with 9 specialized AI agents, collaborate with your team using approval workflows, analyze performance with deep analytics, and manage all social engagement from a unified inbox. Trusted by professionals worldwide — free plan available, paid plans from
Every time a user interacts with your content online, a data point is generated. From a fleeting glance at a video to a deep, thoughtful comment on a professional post, this continuous stream of information holds the key to understanding your audience. However, without a structured approach, this wealth of data can quickly become overwhelming. A practical introduction to social media analytics is essential for any professional looking to cut through the noise, move beyond vanity metrics, and make informed, strategic decisions.
Social media analytics is the practice of gathering data from social platforms and analysing that data to make business decisions. It is the mechanism by which you determine whether your creative efforts are resonating with your target audience and driving tangible results. In this comprehensive guide, we will explore the foundational metrics you need to track, how to interpret platform-specific data, and how to build a reporting framework that actually informs your strategy.
Core Pillars
The Three Pillars of Social Media Analytics
To establish a robust analytics framework, it is vital to categorise your data into logical pillars. By organising metrics into these three distinct areas, you can align your social media performance directly with your broader business objectives.
Awareness
Awareness metrics tell you how far your content is travelling. They measure visibility and audience size, helping you understand the absolute top of your marketing funnel. Key metrics include Reach, Impressions, and Follower Growth.
Engagement
Engagement metrics reveal how people interact with your content once they see it. This is a strong indicator of content quality and audience relevance. Metrics include Likes, Comments, Shares, Saves, and Dwell Time.
Conversion
Conversion metrics track the actions users take outside the social platform as a result of your content. This connects social media to business revenue. Key metrics include Link Clicks, Form Submissions, and Direct Purchases.
Understanding the interplay between these pillars is crucial. For instance, high awareness but low engagement suggests your content is reaching people, but failing to resonate. High engagement but low conversion indicates an active community that may lack a clear call-to-action or incentive to leave the platform.
Key Takeaway: Reach vs. Impressions
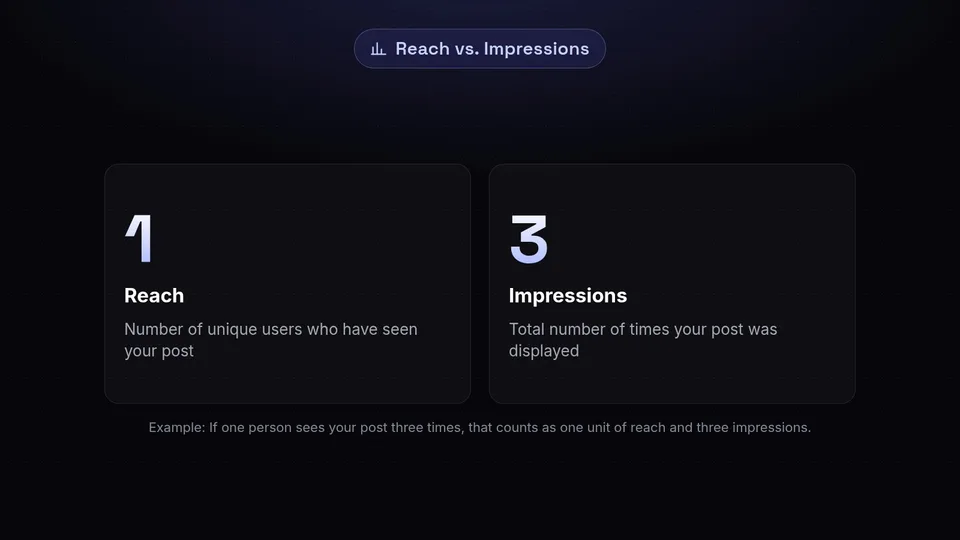
These two terms are often confused but represent different mechanisms. Reach is the number of unique users who have seen your post. Impressions represent the total number of times your post was displayed, regardless of whether it was clicked or not. If one person sees your post three times, that counts as one unit of reach and three impressions.
Implementation
Setting Up Your Analytics Framework
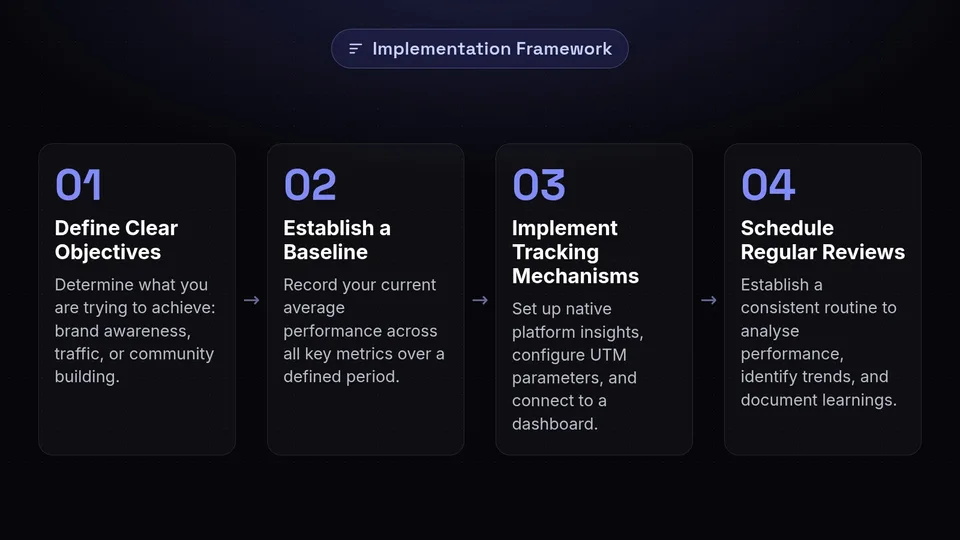
A practical introduction to social media analytics must include actionable steps for implementation. You cannot simply log into a platform and hope the data makes sense; you must build a structured framework for measurement.
Define Clear Objectives
Before looking at a single chart, determine what you are trying to achieve. Are you looking to increase brand awareness, drive traffic to a new landing page, or build a community of brand advocates? Your objective dictates which metrics you should prioritise.
Establish a Baseline
You cannot measure growth without knowing your starting point. Record your current average performance across all key metrics over a defined period (e.g., the last 30 days). This baseline will serve as the benchmark against which all future campaigns are measured.
Implement Tracking Mechanisms
Ensure you have the right tools in place. This includes setting up native platform insights, configuring UTM parameters for any external links to track website traffic accurately, and connecting your profiles to a unified dashboard.
Schedule Regular Reviews
Data is only useful if it is reviewed consistently. Establish a routine—whether weekly, fortnightly, or monthly—to analyse your performance, identify trends, and document learnings. Consistent review cycles allow for agile adjustments to your content calendar.
Ready to simplify your data analysis?
Stop logging into multiple platforms to gather your metrics. Consolidate your data and uncover actionable insights with SchedulifyX.
Start Your Free Trial →Platform Nuances
Understanding Platform-Specific Metrics
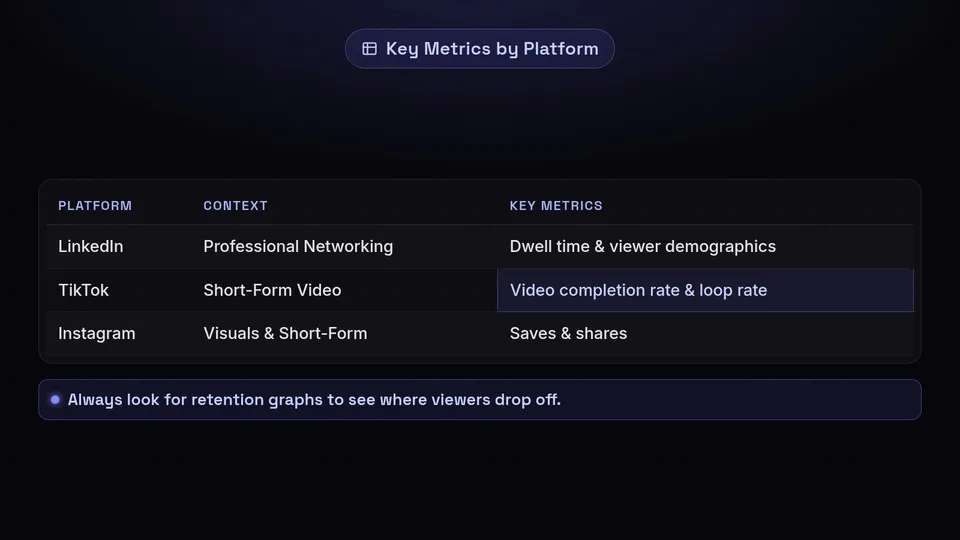
While the core pillars of analytics remain consistent, the specific metrics that matter most can vary significantly depending on the platform. Algorithms are designed differently, and user behaviour shifts from network to network. A comprehensive approach requires understanding these nuances.
Professional Networking
On platforms like LinkedIn, the context is professional development and B2B networking. Here, metrics like "demographics of viewers" (job titles, industries, company sizes) are incredibly valuable. Furthermore, the algorithm heavily favours "dwell time"—the amount of time a user spends looking at a post before scrolling. Long-form text posts and document sliders often perform well because they naturally increase dwell time, signalling to the platform that the content is highly engaging.
Visual and Short-Form Video
Conversely, on visual platforms like Instagram and TikTok, the mechanisms of engagement are different. For short-form video, "Video Completion Rate" and "Loop Rate" are critical indicators of success. If users watch a video to the end and let it replay, the algorithm is highly likely to push that content to a broader audience. On Instagram, "Saves" and "Shares" are often weighted more heavily than simple likes, as they indicate content that users find valuable enough to keep or distribute to their own networks.
Pro Tip: When evaluating video content across multiple platforms, do not just look at total views. A "view" is counted differently on every network (e.g., 3 seconds vs. 1 millisecond). Always look for retention graphs to see exactly where viewers are dropping off in your videos.
Advanced Techniques
Moving Beyond Vanity Metrics
One of the most common pitfalls in social media management is the over-reliance on vanity metrics. Vanity metrics are numbers that look impressive on paper but offer little insight into how social media is contributing to your broader business goals. Follower count is the most notorious example.
While a large follower count can provide social proof, it does not guarantee engagement or revenue. Due to algorithmic timelines, a user who follows your page may rarely see your content unless they actively engage with it. Therefore, an active, engaged community of a smaller size is vastly more valuable than a massive, dormant audience.
- Focus on Engagement Rate: Instead of total likes, calculate your engagement rate (Total Engagements / Total Reach x 100). This provides a true measure of how compelling your content is to the people who actually see it.
- Track Click-Through Rates (CTR): If your goal is to drive traffic, monitor the percentage of people who click your link after viewing your post. A high reach with a low CTR indicates a disconnect between your content and your call-to-action.
- Monitor Sentiment: Not all engagement is positive. Reading comments and categorising the sentiment (positive, neutral, negative) helps you understand brand perception, which raw numbers cannot convey.
- Utilise UTM Tracking: Append Urchin Tracking Module (UTM) parameters to the URLs you share. This allows your website analytics software to attribute specific website visits, leads, and sales back to exact social media posts.
Tooling
Native Insights vs. Consolidated Dashboards
As you apply this practical introduction to social media analytics to your daily workflow, you will face a choice regarding how you collect your data. You can either rely on the native insights provided by each individual platform, or you can utilise a third-party analytics dashboard.
| Feature | Native Platform Insights | SchedulifyX Analytics |
|---|---|---|
| Data Consolidation | ✗ (Requires logging into multiple apps) | ✔ (All platforms in one view) |
| Cross-Platform Reporting | ✗ (Manual compilation required) | ✔ (Automated exportable reports) |
| Historical Data Limits | ✗ (Often restricted to 30-90 days) | ✔ (Extended historical tracking) |
| Team Access | ✗ (Requires sharing native logins/roles) | ✔ (Secure team collaboration) |
While native tools are useful for quick checks, managing a multi-platform strategy requires consolidation. A unified dashboard allows you to compare the performance of a single campaign across X/Twitter, Facebook, and LinkedIn simultaneously, saving hours of manual data entry and spreadsheet formatting.
✔ The Value of Consolidated Analytics
- Identifies cross-platform trends quickly.
- Reduces manual reporting time significantly.
- Provides a single source of truth for stakeholders.
- Integrates seamlessly with your content calendar to inform future posts.
✗ The Cost of Manual Tracking
- High risk of human error when transferring data.
- Time-consuming, detracting from creative strategy.
- Difficult to spot macro-trends across different networks.
Continuous Improvement
Turning Data into Actionable Strategy
The ultimate goal of a practical introduction to social media analytics is not just to understand the numbers, but to let those numbers dictate your future actions. Data without action is merely trivia.
When you sit down to review your metrics, ask yourself diagnostic questions. If a particular post format (e.g., a carousel) consistently generates higher engagement rates than static images, how can you adjust your scheduling to include more carousels next month? If you notice that your audience is most active at 8:00 AM, are you ensuring your most important announcements go live at that time?
Furthermore, consider leveraging advanced tools like AI Studio to analyse patterns in your top-performing content, helping you generate new ideas that are statistically more likely to resonate with your audience. By creating a continuous feedback loop—where data informs creation, which generates new data—you transition from merely posting on social media to executing a scientifically grounded digital strategy.
Get started free — no credit card required.
